Discover how our in vitro model of T cell exhaustion can boost your data package

Our assay employs exhausted human T cells to recapitulate dysfunctional T cell responses seen in the tumour microenvironment (TME) or chronic viral infection.

The phenotype and functionality of the exhausted T cells can be recovered by checkpoint blockade and compared directly to your therapeutic candidate.

 Download our technical presentation to view example data and learn how we can adapt the assay to answer your questions.

Delve into real data in our T cell exhaustion webinar

Traditional T cell activation assays employing polyclonal stimuli e.g. SEB-activation, do not generate exhausted T cells and are therefore not reliable for the assessment of a candidate therapeutic’s impact on T cell exhaustion. Here our CSO, Dr Agapitos Patakas presents our in vitro model that produces T cells with the phenotypic and functional characteristics of exhaustion.

Explore high content data of the exhausted T cells characterized by multi-parameter flow cytometry (Novocyte) coupled with cytokine analysis. Functional assessments employ mixed lymphocyte reactions (MLRs) as a model for T cell activation, followed by kinetic assessment of T cell mediated cytotoxicity effector function using the xCELLigence RTCA.

See data we have generated for some of our clients – jump straight to 26 minutes for two case studies.

What is T cell exhaustion?

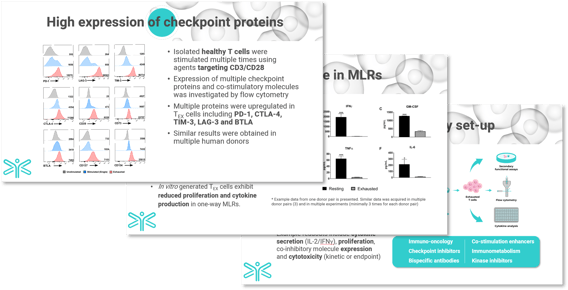
T cell exhaustion is a state of T cell dysfunction characterised by reduced effector activity and elevated cell surface expression of co-inhibitory receptors such as PD-1, LAG-3 and TIM-3. In the presence of repeated antigenic stimulation, such as in the tumour microenvironment (TME), increasing numbers of T cells reach this exhausted state and are less capable of performing their anti-tumour functions.

Exhausted T cells in the TME are hypo-proliferative, exhibit reduced cytotoxicity and an impaired ability to secrete cytokines.

Explore the data in our presentation to learn how our model recapitulates this exhausted state.

T cell Exhaustion slides img final

Why use the Antibody Analytics model to study T cell exhaustion?

Antibody Analytics have established an in vitro process that reliably and consistently generates exhausted T cells from healthy human donor PBMCs.

The T cells are functionally assessed by mixed lymphocyte reaction (MLR) or for cytotoxic capacity in the presence of therapeutic molecules and coupled with phenotypic readouts using flow cytometry. These high-content, data rich assays are designed for the assessment of candidate immunotherapies.

Nivolumab benchmarked assay

Checkpoint inhibition reinvigorates exhausted T cells in a one-way MLR. Nivo is used in every run as an internal benchmark control. PD-1 blockade exhibits successful functional rescue of T cell proliferation and cytokine production.

Pre-screened T cell donors

To maximise assay success, we screen T cell donors in advance, at no additional cost to you, to guarantee alloreactive MLR pairings that can be enhanced by Nivolumab (PD-1 inhibition). For cytotoxicity assessments, we use historical data to guide donor T cell selection.

High content assay readouts

Phenotype and function are measured using a combination of multi-parameter flow cytometry, kinetic (or end point) cytotoxicity measurements and multiplex cytokine readouts. 96-well plate formats provide a medium throughput assay with up to 720 testing wells per run.

In vitro exhausted T cells express TOX

T cell exhaustion data final

TOX; a critical regulator of exhaustion

  • Robust TOX expression has been demonstrated to commit cells to exhaustion, translating persistent stimulation into a distinct exhausted T cell transcriptional and epigenetic developmental program.
  • The transcription factor TOX epigenetically reprograms CD8+ T cells to drive T cell exhaustion during chronic infection and cancer.
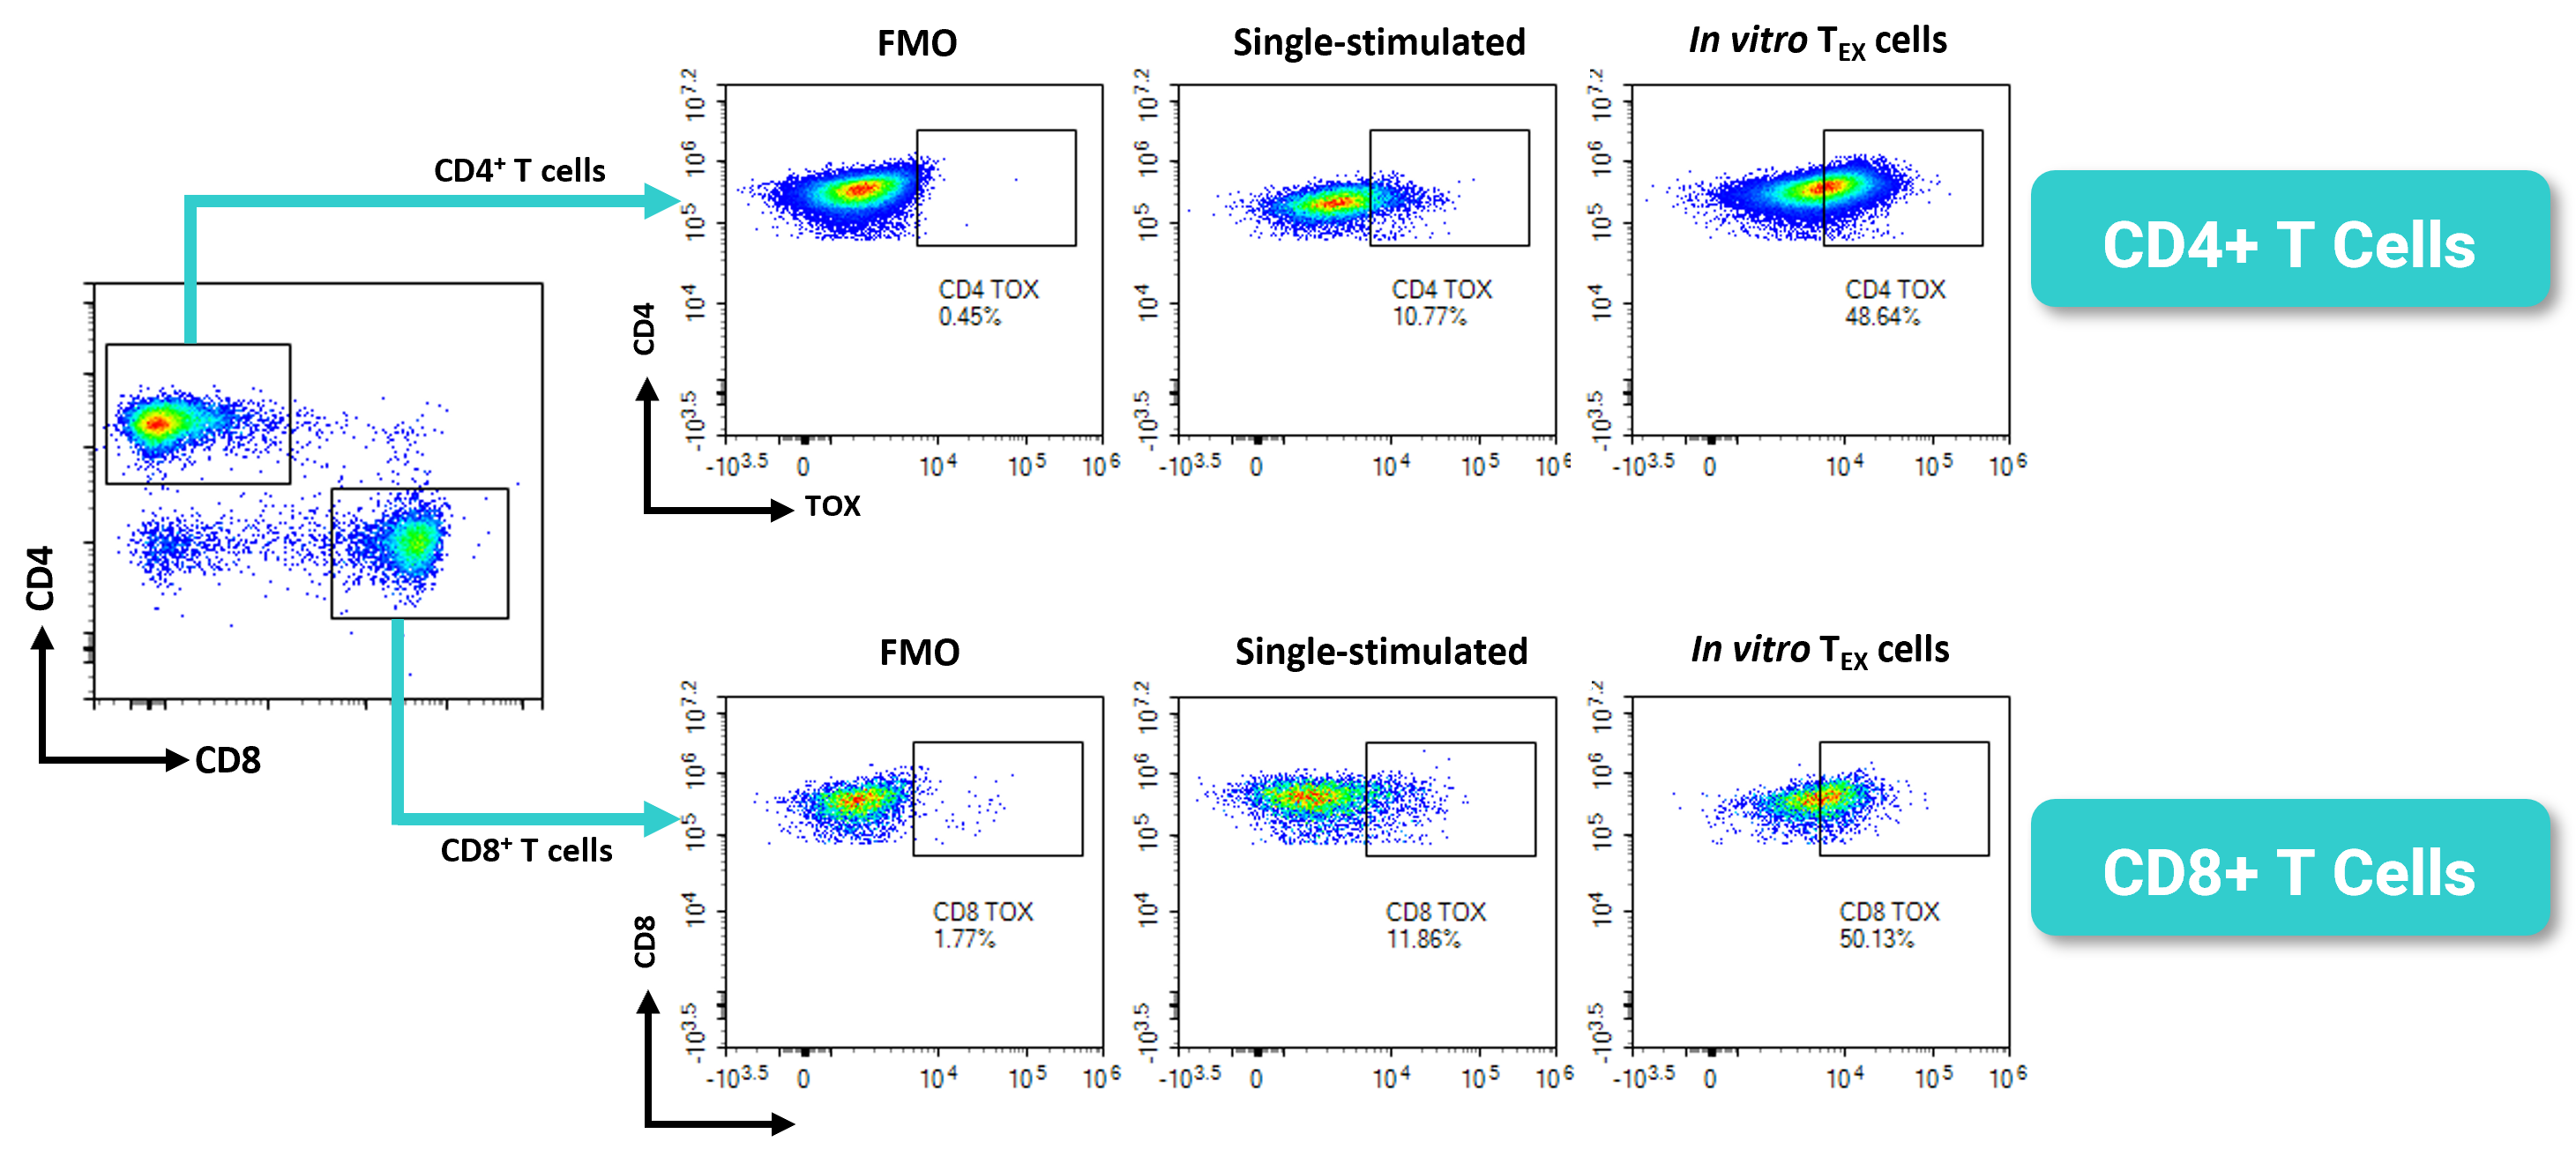
  • In vitro generated exhausted T cells and single-stimulated T cells were assessed for intracellular expression of TOX.
  • Both in vitro exhausted helper (CD4) and cytotoxic (CD8) T cells, exhibit increased levels of TOX.
  • Explore more phenotypic and functional data in our presentation.